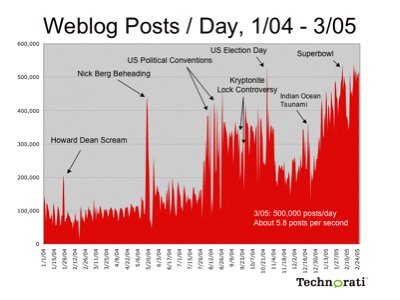
To expand on my post yesterday on the overall growth of the number of weblogs, today I'm going to look at another important measure of the growth of the blogosphere, posting volume. A single post is a single entry to a weblog, whether it be a long essay or just a short entry, each is a post, and the posting volume is the aggregate number of posts per day. Just as it is important to note the increased growth in the number of weblogs out there, it is as or more important to see if blogging is a fad or if people are blogging at a sustained rate. The chart below shows that posting volume has been growing. (Compare with the chart from October 2004)
On average, Technorati is tracking about 500,000 posts per day, which is about 5.8 posts per second. In October 2004, we were seeing about 400,000 posts per day. It is interesting to note that posting volume suffered a decline during the months of November and December, 2004. A large part of this decline is the reduction in postings about US politics after the election in early November. However, the growth of mainstream blogging services becomes apparent when looking at the rise in posting volume starting in December. This is congruent with the increase in the number of new blogs during those months as discussed in yesterday's entry. It is also interesting to watch the spikes in the graph that have accompanied major news events. I haven't done a detailed analysis here but picked out a few spikes that stood out to me. The graph shows the effects of events like the US Political conventions and elections, the Indian Ocean tsunami, and the US Super Bowl. It is important to note that with major events like these, the actual amplitude of the spike is less relevant than size of the spike above the ambient amplitude level. In other words, even though there were fewer posts on the days following the Tsunami, it had a much larger spike than the one that came the day of the Super Bowl. I'm sure there are numerous international events that show up as spikes in this graph, as the number of postings made in non-english languages is now about 40% of the volume of postings that Technorati is tracking.
Tomorrow I'll discuss how blogs are capturing attention compared to mainstream media sites, what news sites are being referenced the most, and how that has been changing over the last few months. Comments and feedback are always welcome and encouraged!
